Bayesian Theory

Bayes Theorem (Source commons.wikimedia.org)
Bayesian Theorem: Adding quantitative evidence to our beliefs
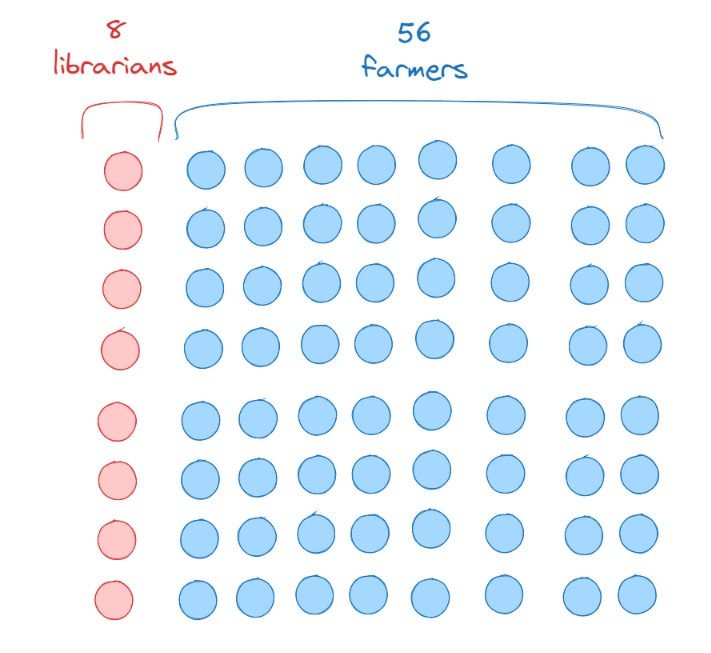
Imagine that we already know that there are 50% librarian that are shy, while there is only 14% farmer that are shy. If we pick random person from the population that is considered shy, what is the probability that the person is a librarian? The heart of bayesian theorem is that when we’re considering our bias that it’s a lot more likely a librarian is shy than a farmer, when we want to say that “Then there should be a lot more shy librarian than shy farmer”, we need to consider that maybe there are a lot more farmer than librarian in the population.
Challenge your belief with quantitative evidence
If you’re checking above image, you’ll see that farmers in our population of 64 people is a lot more than librarians. So let’s try to assess our belief: We say that lots of the librarian are shy (50%), and only small subset of farmer are shy (14%).
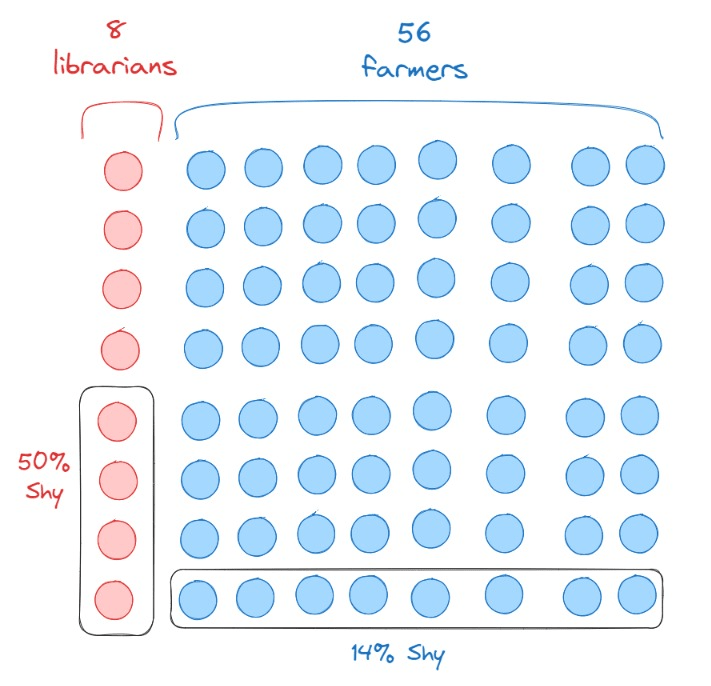
Now look at above image and we can calculate that 14%, when compared to above population of farmers which is 56, is 8 people (7.84 rounded up). While 50% of librarian, when compared to above population of librarians which is 8, is only 4 people. So, even though we know that a librarian is a lot more likely to be shy than a farmer, but because we consider the quantity of farmer in the population, it’s still more likely that if we randomly pick a shy person, it’s a farmer.
This theorem is one of the most important theorem in probability theory, which can help us validate our bias and human tendency, to acknowledge that when considering the quantity of the population, our bias might not be true: 50% librarian are shy, and only 14% farmer are shy, so of course there are more shy librarian than shy farmer. NOPE! Bayesiann theorem can help us to challenge our belief with accurate measurement.
Formula
The mathematical representation for Bayes’ Theorem is:
\[P(H|E) = \frac{P(H).P(E|H)}{P(E)}\]
- \(P(H)\): Probability that a hypothesis is true before any evidence is available.
- \(P(E|H)\): Probability of observing the evidence given that the hypothesis is true.
- \(P(E)\): Probability of observing the evidence.
- \(P(H|E)\): Probability that the hypothesis is true given some evidence.
Okay, formula might be intimidating, let’s try to make it more intuitive:
How likely a person is a coffee drinker given that he is energic in the morning?
\[ P(\text{Coffee Drinker | Energic in the morning}) = \frac{P(\text{Coffee Drinker}).P(\text{Energic in the morning | Coffee Drinker})}{P(\text{Energic in the morning})} \]
Some people are energic in the morning because they drink coffee, but some people are energic in the morning because they are just morning people. What’s the probability that a person is a coffee drinker given that he is energic in the morning?
\(P(\text{Coffee Drinker | Energic in the morning})\): The probability that a person is a coffee drinker given that he is energic in the morning (not all energic people are coffee drinkers)
\(P(\text{Coffee Drinker})\): The percentage of coffee drinkers in the population
\(P(\text{Energic in the morning | Coffee Drinker})\): The percentage of energic people given that they are coffee drinkers (not all coffee drinkers are energic)
\(P(\text{Energic in the morning})\): The percentage of energic people in the population
How likely is it that a person is a librarian given that he is shy?
\[ P(\text{Librarian | Shy}) = \frac{P(\text{Librarian}) . P(\text{Shy | Librarian})}{P(\text{Shy})} \]
Some shy people are librarians, but some shy people are shy even though they are not librarians. What’s the probability that a person is a librarian given that he is shy?
\(P(\text{Librarian | Shy})\): The probability that a person is a librarian given that he is shy (not all shy people are librarians)
\(P(\text{Librarian})\): The percentage of librarians in the population
\(P(\text{Shy | Librarian})\): The percentage of shy people given that they are librarians (not all librarians are shy)
\(P(\text{Shy})\): The percentage of shy people in the population
| == Given that
One tips to remember the formula is that | can be seen as given that. So \(P(\text{Coffee Drinker | Energic in the morning})\) can be read as “The probability that a person is a coffee drinker given that he is energic in the morning”. It’s a way to easily remember the formula.
Example
Let’s try to use below example to understand how Bayes’ Theorem works:
In a factory, there are several machines used for manufacturing a specific product. We want to know, if we observe a product defect, what is the probability that it was caused by a specific machine, let’s called it Machine A.
\[ P(\text{Machine A | Defect}) = \frac{P(\text{Machine A}) \times P(\text{Defect | Machine A})}{P(\text{Defect})} \]
Several things that we know is that there are 1000 products manufactured, 300 of them are made using Machine A. Out of the 1000 products, 20 of them are defective. Out of the 300 products made by Machine A, 5 of them are defective. So, what is the probability that a product is defective, given that it was manufactured by Machine A?
Convert above formula to more “human” language
Let’s change above formula to more understandable language:
\[ P(\text{Probability of Machine A is used given that there is a defect}) = \frac{P(\text{Probability of Machine A is used}) \times P(\text{Probability of a defect given it's manufactured by Machine A})}{P(\text{Probability of a defect})}\]
So basically when we’re looking at a random defective product, what is the probability that it was manufactured by Machine A?
Plot the numbers
\[ P(\text{Probability of Machine A is used given that there is a defect}) = \frac{\frac{300}{1000} \times \frac{5}{300}}{\frac{20}{1000}} = 25\% \]
Now after using the formula, we can see that if we choose a random defective product, there is 25% chance that it was manufactured by Machine A. This might be a high number say if we really don’t want any defective product, we can then choose to lessen the usage of Machine A. Of course it might be considered a low number if we consider that it’s only happening 20 out of 1000 times, it’s all about how the business considered high or low number. But the main takeaway is that we can use Bayes’ Theorem to expand our belief using a real data to validate our belief.