Decision Tree is a one of a popular (and simple) machine learning model. It’s a supervised learning model that can be used for both classification and regression. The intuition behind the decision tree is simple, yet powerful. It’s a tree-like model that makes a decision based on the given features. The decision tree is a white-box model, which means that it’s easy to interpret the model’s decision.
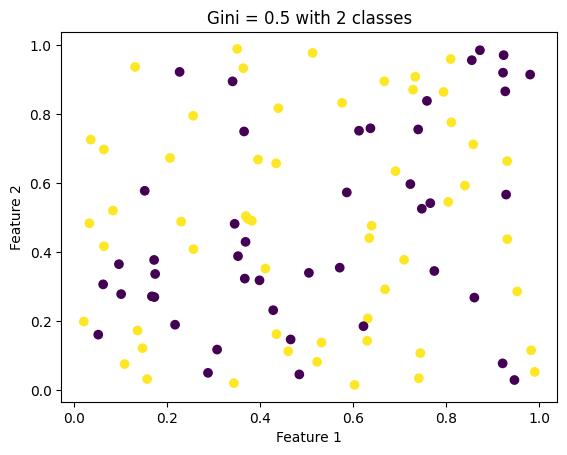
# Make a sample dataset to illustrate GINI impurityimport numpy as npimport matplotlib.pyplot as plt# Create a sample data set with 2 features and 2 classes and 100 samples# The GINI impurity should be = 0.5X = np.random.rand(100, 2)y = np.random.randint(0, 2, 100)# Plot the dataplt.scatter(X[:, 0], X[:, 1], c=y)plt.xlabel('Feature 1')plt.ylabel('Feature 2')# Set gini number to the titleplt.title('Gini = 0.5 with 2 classes')plt.show()
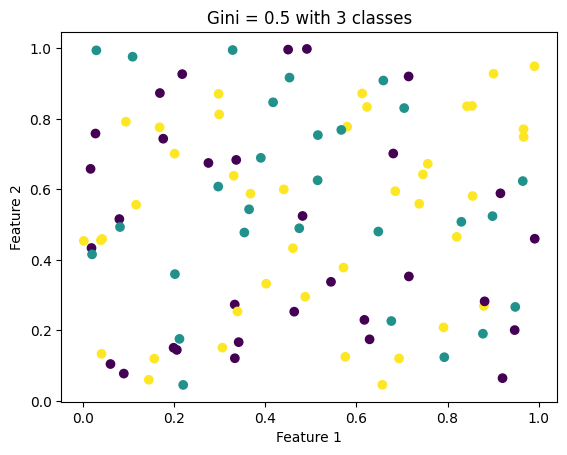
# Make a sample dataset to illustrate GINI impurityimport numpy as npimport matplotlib.pyplot as plt# Create a sample data set with 2 features and 3 classes and 100 samples# The GINI impurity should be = 0.5X = np.random.rand(100, 2)y = np.random.randint(0, 3, 100)# Plot the dataplt.scatter(X[:, 0], X[:, 1], c=y)plt.xlabel('Feature 1')plt.ylabel('Feature 2')# Set gini number to the titleplt.title('Gini = 0.5 with 3 classes')plt.show()
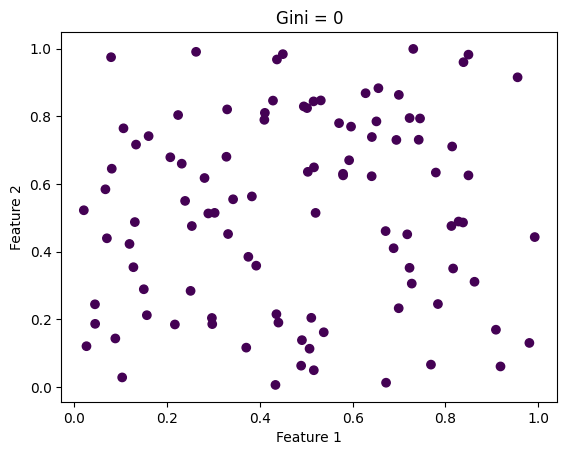
# Make a sample dataset to illustrate GINI impurityimport numpy as npimport matplotlib.pyplot as plt# Create a sample data set with 2 features and 2 classes and 100 samples# The GINI impurity should be = 0X = np.random.rand(100, 2)y = np.zeros(100)# Plot the dataplt.scatter(X[:, 0], X[:, 1], c=y)plt.xlabel('Feature 1')plt.ylabel('Feature 2')# Set gini number to the titleplt.title('Gini = 0')plt.show()
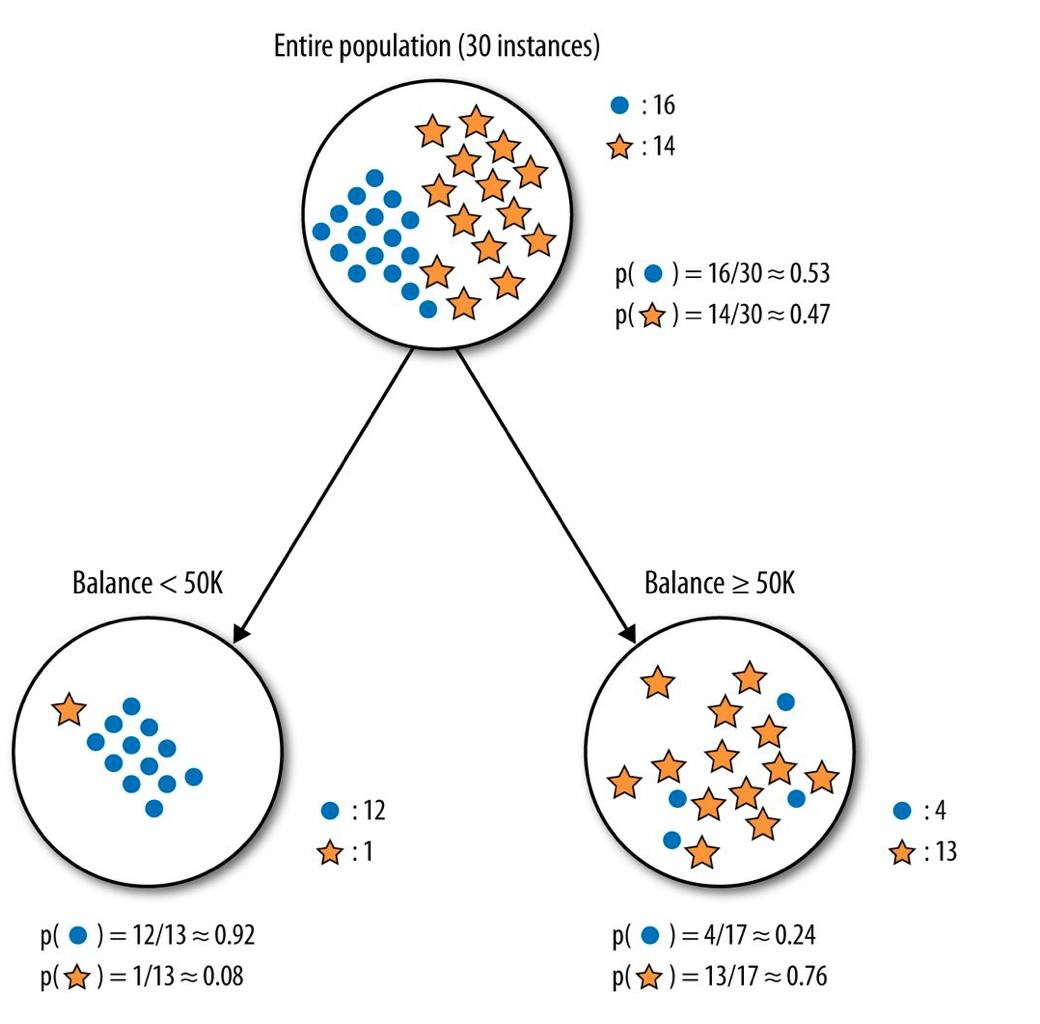
Example
Go to this link and try to split the data manually
Your goal: decide which feature the dataset should be split by to get better GINI value
Machine Learning Approach
Now let the machine do it for us:
!pip install pydotplus
# load assets/decision-tree-exercise.csvimport pandas as pdimport numpy as npdf = pd.read_csv('assets/decision-tree-exercise.csv')df.head()
Ticket Price
Holiday duration
Jakarta PM 2.5
Temperature
Hectic in company?
Holiday to Bali
0
1200000
10
198
35
Y
True
1
641374
4
103
31
Y
False
2
1381146
9
194
39
Y
True
3
1478889
7
169
32
N
False
4
897024
5
189
32
N
False
df.dtypes
Ticket Price           int64
Holiday duration       int64
Jakarta PM 2.5         int64
Temperature            int64
Hectic in company?    object
Holiday to Bali         bool
dtype: object
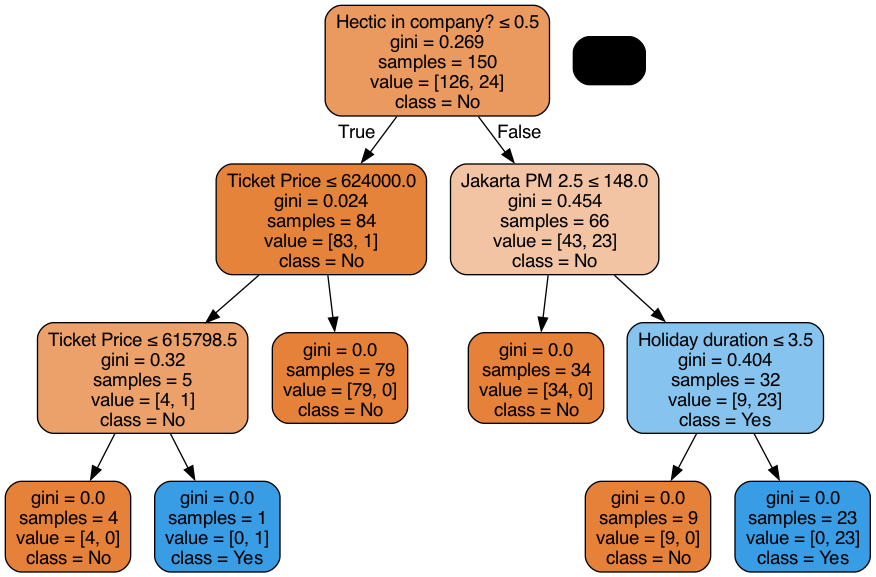
# Build decision tree model using sci-kit learnfrom sklearn.tree import DecisionTreeClassifiercolumns = ["Ticket Price", "Holiday duration", "Jakarta PM 2.5", "Temperature", "Hectic in company?"]# convert Hectic in company? (y/n) to numericdf["Hectic in company?"] = df["Hectic in company?"].map({"Y": 1, "N": 0})# convert "Holiday to Bali" (TRUE/FALSE) to numericdf["Holiday to Bali"] = df["Holiday to Bali"].map({True: 1, False: 0})X = df[columns]y = df["Holiday to Bali"]
X
Ticket Price
Holiday duration
Jakarta PM 2.5
Temperature
Hectic in company?
0
1200000
10
198
35
1
1
641374
4
103
31
1
2
1381146
9
194
39
1
3
1478889
7
169
32
0
4
897024
5
189
32
0
...
...
...
...
...
...
195
537683
10
124
37
1
196
1194739
1
104
33
1
197
1124824
5
161
32
1
198
718404
5
177
37
1
199
599056
5
185
39
0
200 rows × 5 columns
# Split data into training and testingfrom sklearn.model_selection import train_test_splitX_train, X_test, y_train, y_test = train_test_split(X, y)
There are alternative metrics to using Gini impurity that can help us in building our Decision Tree:
Entropy: This is a measure of disorder or uncertainty. The entropy of a dataset is used for calculating the information gain, which is the reduction in entropy after a dataset is split on an attribute. Constructing a decision tree involves finding the attribute that returns the highest information gain (i.e., the most homogeneous branches).
Information Gain: This is the reduction in entropy or surprise that results from partitioning the data on an attribute. The decision tree will make the split where information gain is maximum, or equivalently, where entropy is minimum.